Diagrams using PlantUml
This is not something new, but It can be useful for somebody.
Sometimes we need to create diagrams. It is easy to do on paper. And what if we need to do it not on paper.
We have a huge list of tools. My favorite is Draw.io. And in the case of Draw.io, we have to draw something.
But what if you do not have drawing skills 🙂
Here is PlantUML. Using this “language” you able to create diagrams from code. Here are some examples:
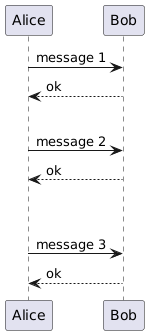
Sequence diagram
@startuml
Alice -> Bob: message 1
Bob --> Alice: ok
|||
Alice -> Bob: message 2
Bob --> Alice: ok
||45||
Alice -> Bob: message 3
Bob --> Alice: ok
@enduml
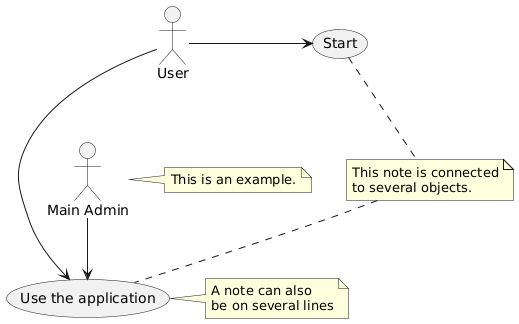
Use Case Diagram
@startuml
:Main Admin: as Admin
(Use the application) as (Use)

User -> (Start)
User --> (Use)

Admin ---> (Use)

note right of Admin : This is an example.

note right of (Use)
A note can also
be on several lines
end note

note "This note is connected\nto several objects." as N2
(Start) .. N2
N2 .. (Use)
@enduml
Class Diagram
@startuml

abstract class AbstractList
abstract AbstractCollection
interface List
interface Collection

List <|-- AbstractList
Collection <|-- AbstractCollection

Collection <|- List
AbstractCollection <|- AbstractList
AbstractList <|-- ArrayList

class ArrayList {
Object[] elementData
size()
}

enum TimeUnit {
DAYS
HOURS
MINUTES
}

annotation SuppressWarnings

@enduml
Activity Diagram
@startuml

start

repeat :foo as starting label;
  :read data;
  :generate diagrams;
backward:This is backward;
repeat while (more data?)

stop

@enduml
Component Diagram
@startuml

package "Some Group" {
  HTTP - [First Component]
  [Another Component]
}

node "Other Groups" {
  FTP - [Second Component]
  [First Component] --> FTP
}

cloud {
  [Example 1]
}


database "MySql" {
  folder "This is my folder" {
    [Folder 3]
  }
  frame "Foo" {
    [Frame 4]
  }
}


[Another Component] --> [Example 1]
[Example 1] --> [Folder 3]
[Folder 3] --> [Frame 4]

@enduml
State Diagram
@startuml
hide empty description
[*] --> State1
State1 --> [*]
State1 : this is a string
State1 : this is another string

State1 -> State2
State2 --> [*]
@enduml
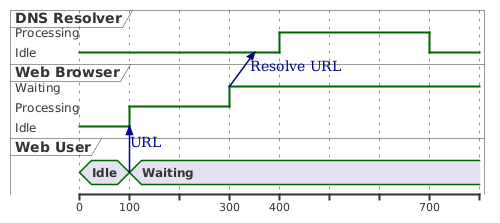
Timing Diagram
@startuml
robust "DNS Resolver" as DNS
robust "Web Browser" as WB
concise "Web User" as WU

@0
WU is Idle
WB is Idle
DNS is Idle

@+100
WU -> WB : URL
WU is Waiting
WB is Processing

@+200
WB is Waiting
WB -> DNS@+50 : Resolve URL

@+100
DNS is Processing

@+300
DNS is Idle
@enduml
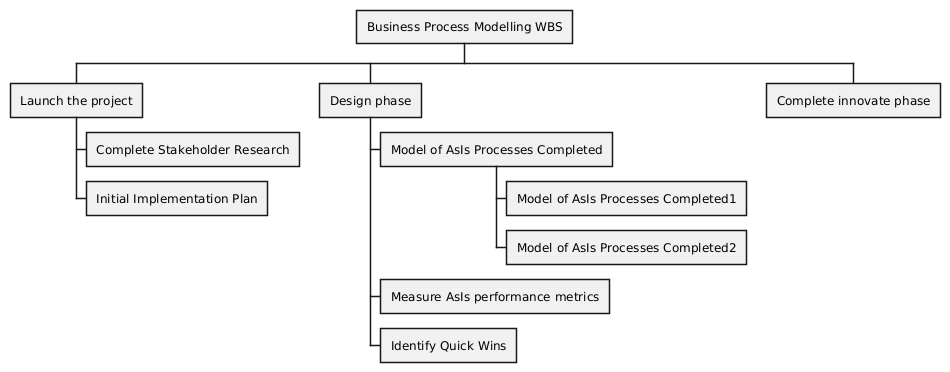
Work Breakdown Structure (WBS)
@startwbs
* Business Process Modelling WBS
** Launch the project
*** Complete Stakeholder Research
*** Initial Implementation Plan
** Design phase
*** Model of AsIs Processes Completed
**** Model of AsIs Processes Completed1
**** Model of AsIs Processes Completed2
*** Measure AsIs performance metrics
*** Identify Quick Wins
** Complete innovate phase
@endwbs
Examples from plantuml.com
![PlantUML Syntax:<br />
@startuml</p>
<p>abstract class AbstractList<br />
abstract AbstractCollection<br />
interface List<br />
interface Collection</p>
<p>List <|– AbstractList<br />
Collection <|– AbstractCollection</p>
<p>Collection <|- List<br />
AbstractCollection <|- AbstractList<br />
AbstractList <|– ArrayList</p>
<p>class ArrayList {<br />
Object[] elementData<br />
size()<br />
}</p>
<p>enum TimeUnit {<br />
DAYS<br />
HOURS<br />
MINUTES<br />
}</p>
<p>annotation SuppressWarnings</p>
<p>@enduml<br />](http://www.plantuml.com/plantuml/img/PP3B2i9034Nt-OfPwi8_SA5OGK4js1OHSH5hb95fAfDquUlVjRNI5fStv-JE0qQYwBN87E11r6Eg9dKeOiPrN5ZHXlscazmvIjNc39QL_0bJCfNQn9PJ4ZDy3WRTsiRemjPcL_aUyQzLh5FT3dMvztYhMFt0NpOF20-NJz5kRyXHHgm1AeBOE_Nwy0BY8ZEnpIXXMzh1U1l1B4pM4IpdgoIUHXy9cNF5wZ9HSRrw4jcWPyjdWH7niVpYDm00)

![PlantUML Syntax:<br />
@startuml</p>
<p>package “Some Group” {<br />
HTTP – [First Component]<br />
[Another Component]<br />
}</p>
<p>node “Other Groups” {<br />
FTP – [Second Component]<br />
[First Component] –> FTP<br />
}</p>
<p>cloud {<br />
[Example 1]<br />
}</p>
<p>database “MySql” {<br />
folder “This is my folder” {<br />
[Folder 3]<br />
}<br />
frame “Foo” {<br />
[Frame 4]<br />
}<br />
}</p>
<p>[Another Component] –> [Example 1]<br />
[Example 1] –> [Folder 3]<br />
[Folder 3] –> [Frame 4]</p>
<p>@enduml<br />](http://www.plantuml.com/plantuml/img/RP312i8m343l_Ogm-mwYPr74wKKKjjlmKDVE3TjcjXqeuh-RRigc23saUSbBKxPmdblVQiKQNbpuMKAKefQmiTWs4JpODiiE4CUG9xLr7bQe6pJI-2FBbmPz9UquzsG61Jds7UWaBbYIjoIL1HhnPVdrKjqSg9vSXS9MK7U-ld7TA0cJC45mpq_SqPJTFRsge2zH2PeNPLNjW8w-GvyAC4zwEWtDfUMqNPGWzgYxpW9v_bkeUynu_2ZksI0VmZVvk1VIYF33Bm00)
![PlantUML Syntax:<br />
@startuml<br />
hide empty description<br />
[*] –> State1<br />
State1 –> [*]<br />
State1 : this is a string<br />
State1 : this is another string</p>
<p>State1 -> State2<br />
State2 –> [*]<br />
@enduml<br />](http://www.plantuml.com/plantuml/img/ut8eBaaiAYdDpU7Ao4n9LKZDBIYfL4X9BKukoYmeoSpFuuhMYbNGrRLJ22v9B4arv89GO16W38nhfL2IaLci04I92iKbHPbvwLXayl9BCbABqEHX9Xj118pW9ZkavgM0d0K0)

0 Comments